Quick Start
Lets start with initialising an ImageStack. Its a container object for a stack of images. The crack detection
works with this container objects to process the whole image stack at once.
It is also possible to work just with a list of images if no extra functionality from ImageStack is needed.
Create an stack and add images to it. The images in this example can be downloaded
here. Unpack the folder and set the working directory in the parent folder of
example_images.
import numpy as np
import crackdect as cd
# read image paths from folder
paths = cd.image_paths('example_images')

# We want the dtype of the images to be np.float32 and only grayscale images.
stack = cd.ImageStack.from_paths(paths,  dtype=np.float32, as_gray=True)
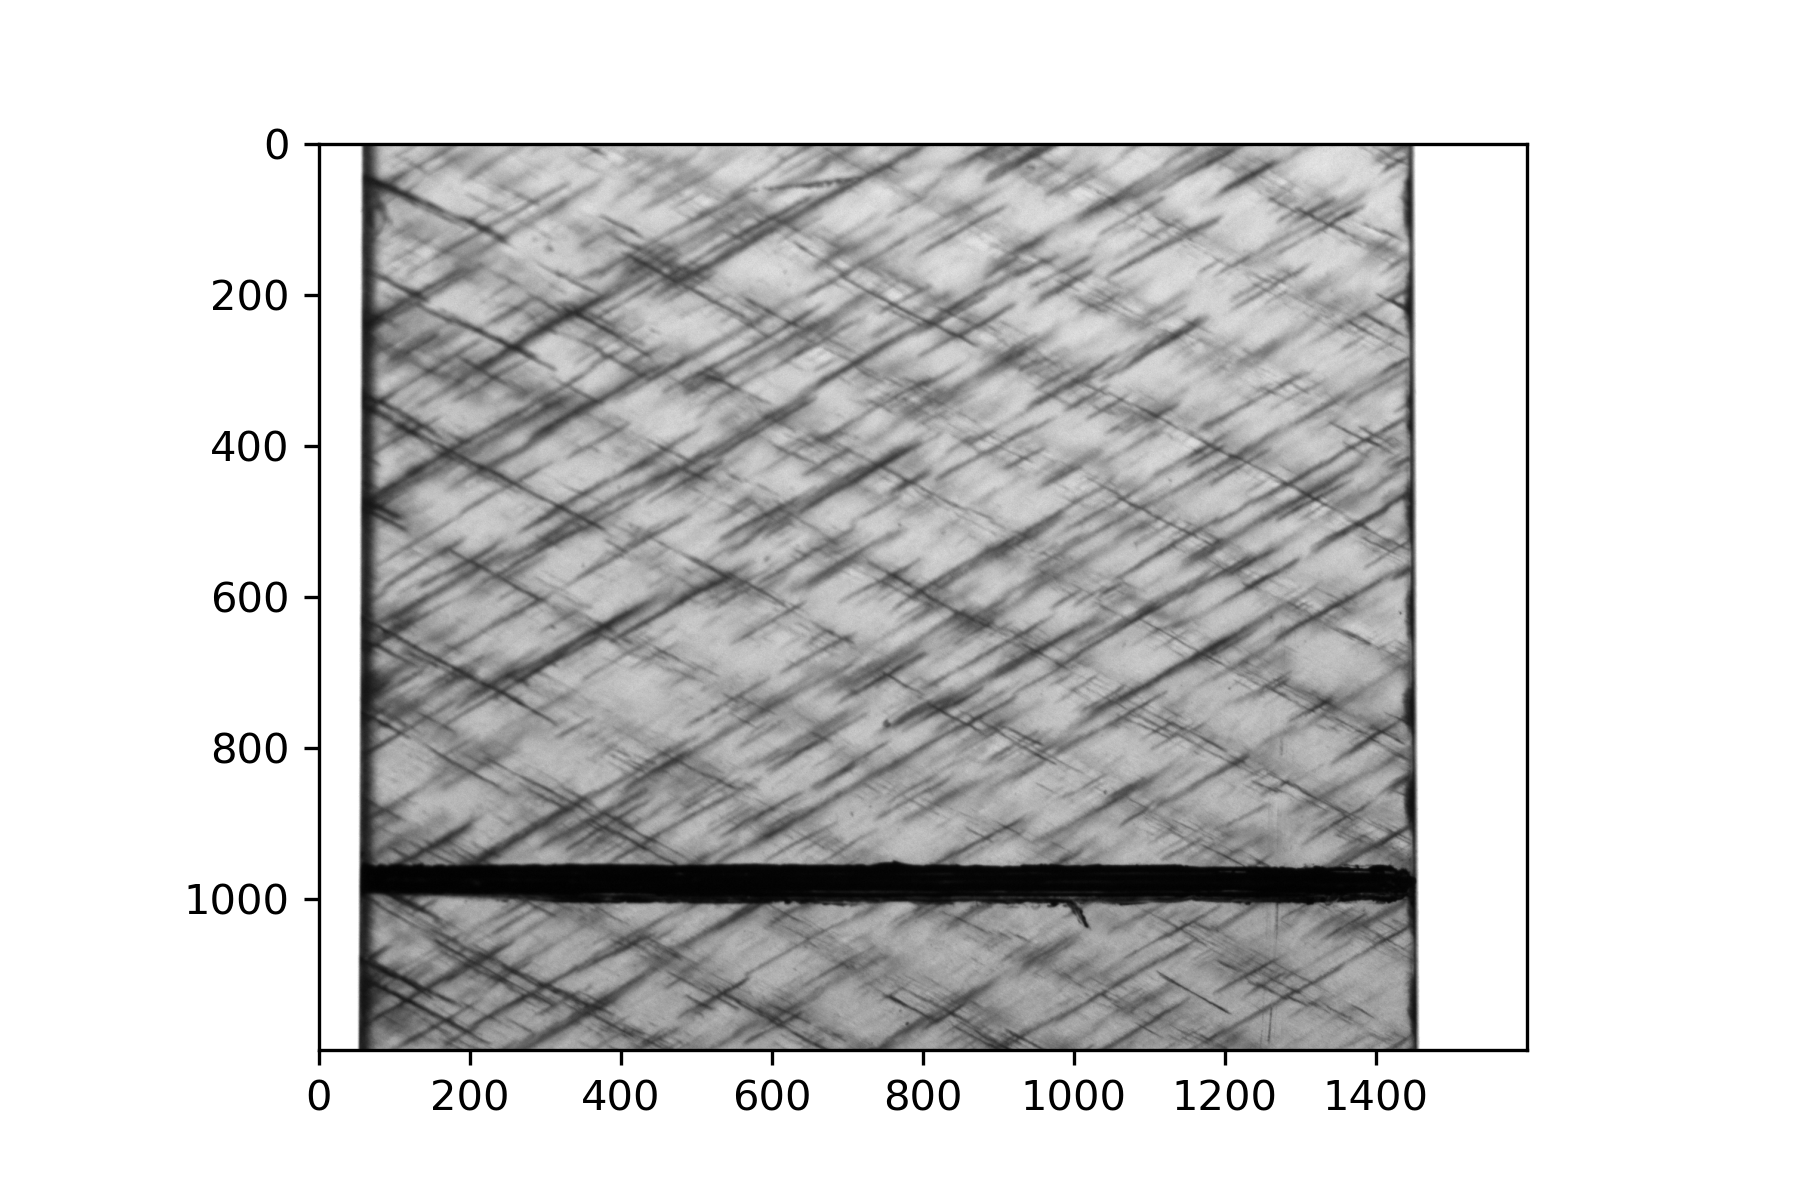
The following image shows the last image from the stack. A lot of small and some bigger cracks are visible. Also, the region of interest is only the middle part of the specimen without the edges of the specimen and the painted black bar.
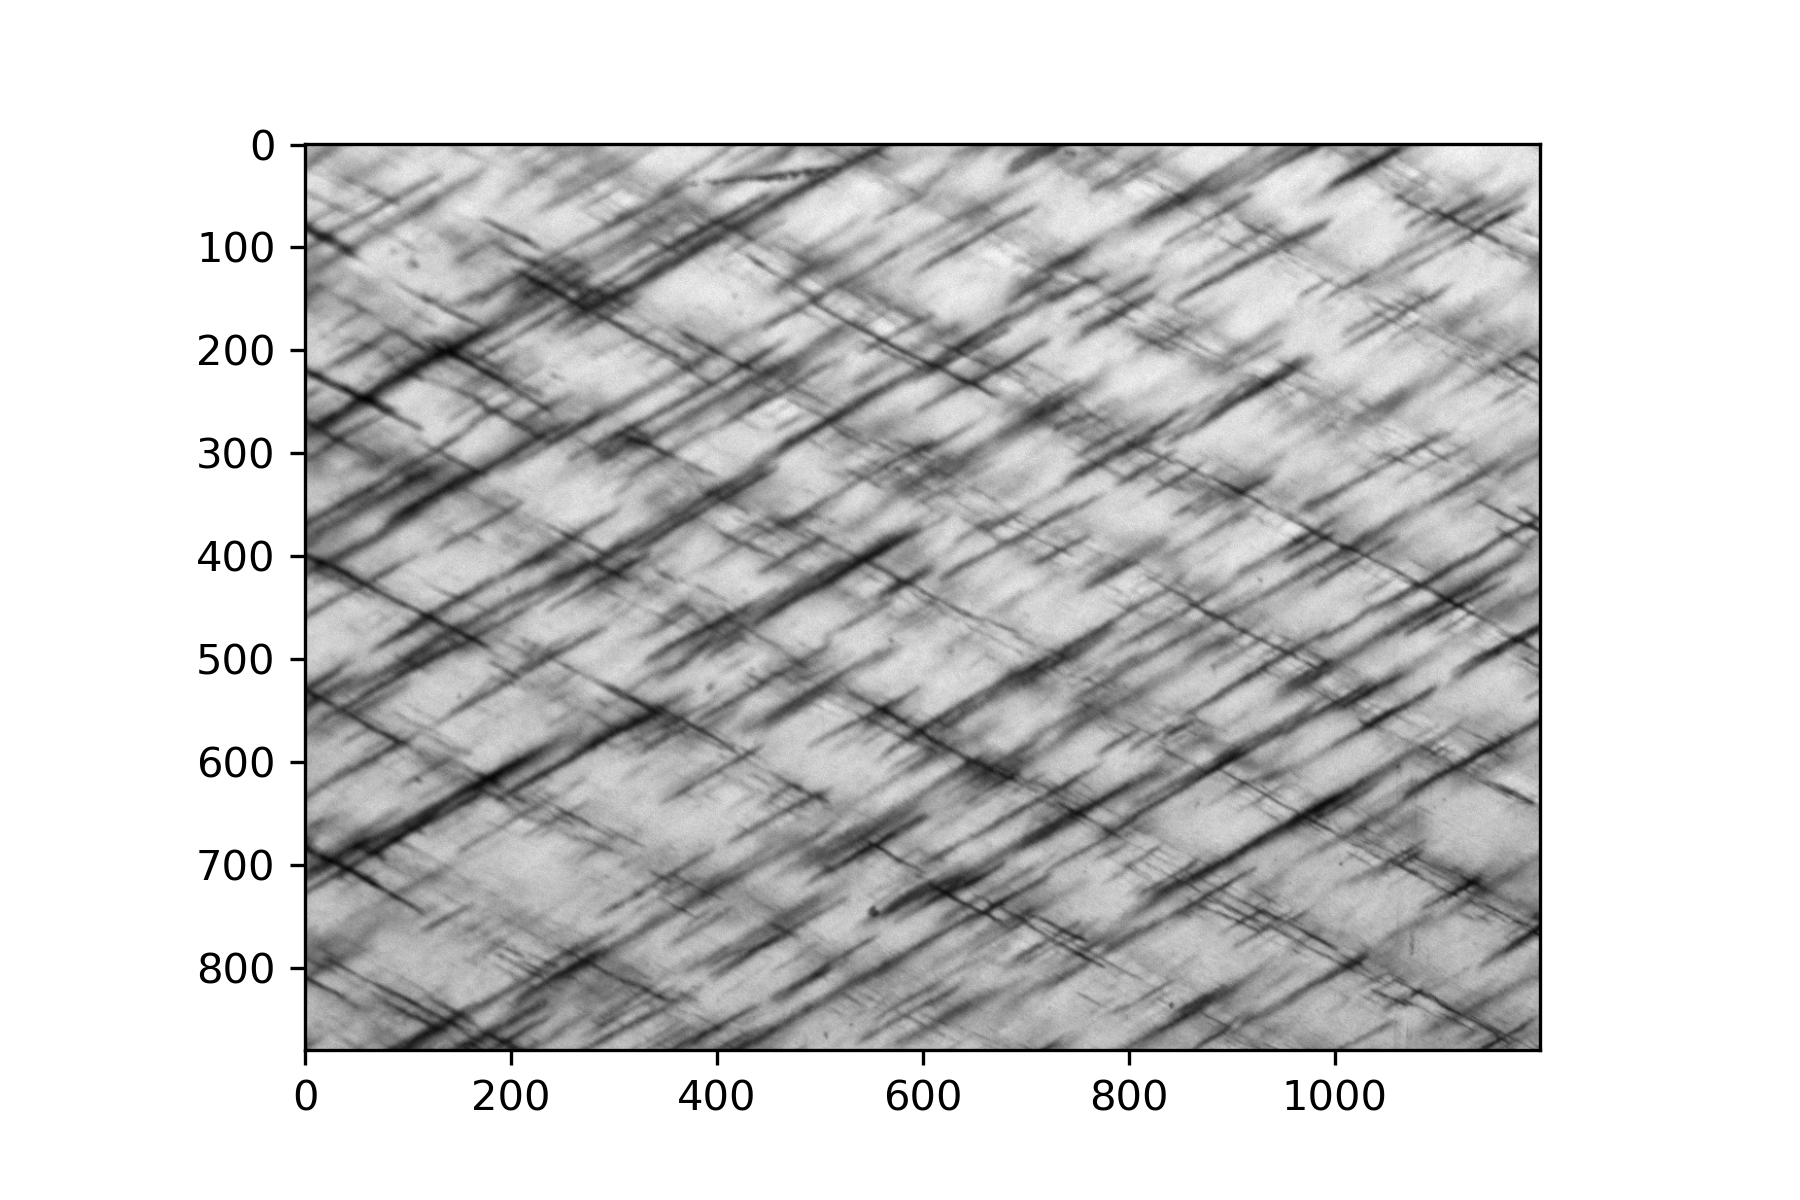
Before cutting to the desired shape a shift correction is necessary to align all images in a global coordinate system. The following image shows the last image of the stack after the shift correction and the cut to the region of interest.
# shift correction to align all images in one coordinate system
cd.shift_correction(stack)

# The region of interest is form pixel 200-1400 in x and 20-900 in y
cd.region_of_interest(stack, 200, 1400, 20, 900)
Currently, three functions using different algorithms for crack detection are available in the package.
For this tutorial, detect_cracks(), the simplest crack detection function with the least
prerequisites in image preprocessing is used.
For more information go to Crack Detection.
Only cracks in a set direction are detected with detect_cracks(). For the algorithm to
work properly, the following arguments must be set.
theta: The angle between the cracks and a vertical line.
crack_width: Approximate width of the major detected cracks in pixels. This value is taken as the wavelength of the Gabor kernel.
ar: The aspect ratio of the kernel. Since cracks are usually long and thin an aspect ratio bigger than 1 should be chosen. A good compromise between speed and accuracy is 2. Too big aspect ratios can lead to false detection.
min_size: The minimum length of detected cracks in pixels. Since small artifacts or noise can lead to false detection, this parameter provides an reliable filter.
# crack detection
rho, cracks, thd = cd.detect_cracks(stack, theta=60, crack_width=10, ar=2, bandwidth=1, min_size=10)
The results can be plotted and inspected.
# plot the crack density
import matplotlib.pyplot as plt
plt.plot(np.arange(len(stack)), rho)
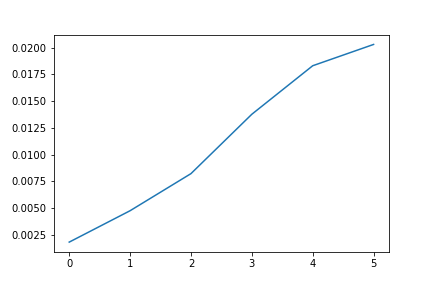
The crack density is growing with each image. To look if all cracks are detected lets look at the last image in the stack.
# plot the background image and the associated cracks
cd.plot_cracks(stack[-1], cracks[-1])
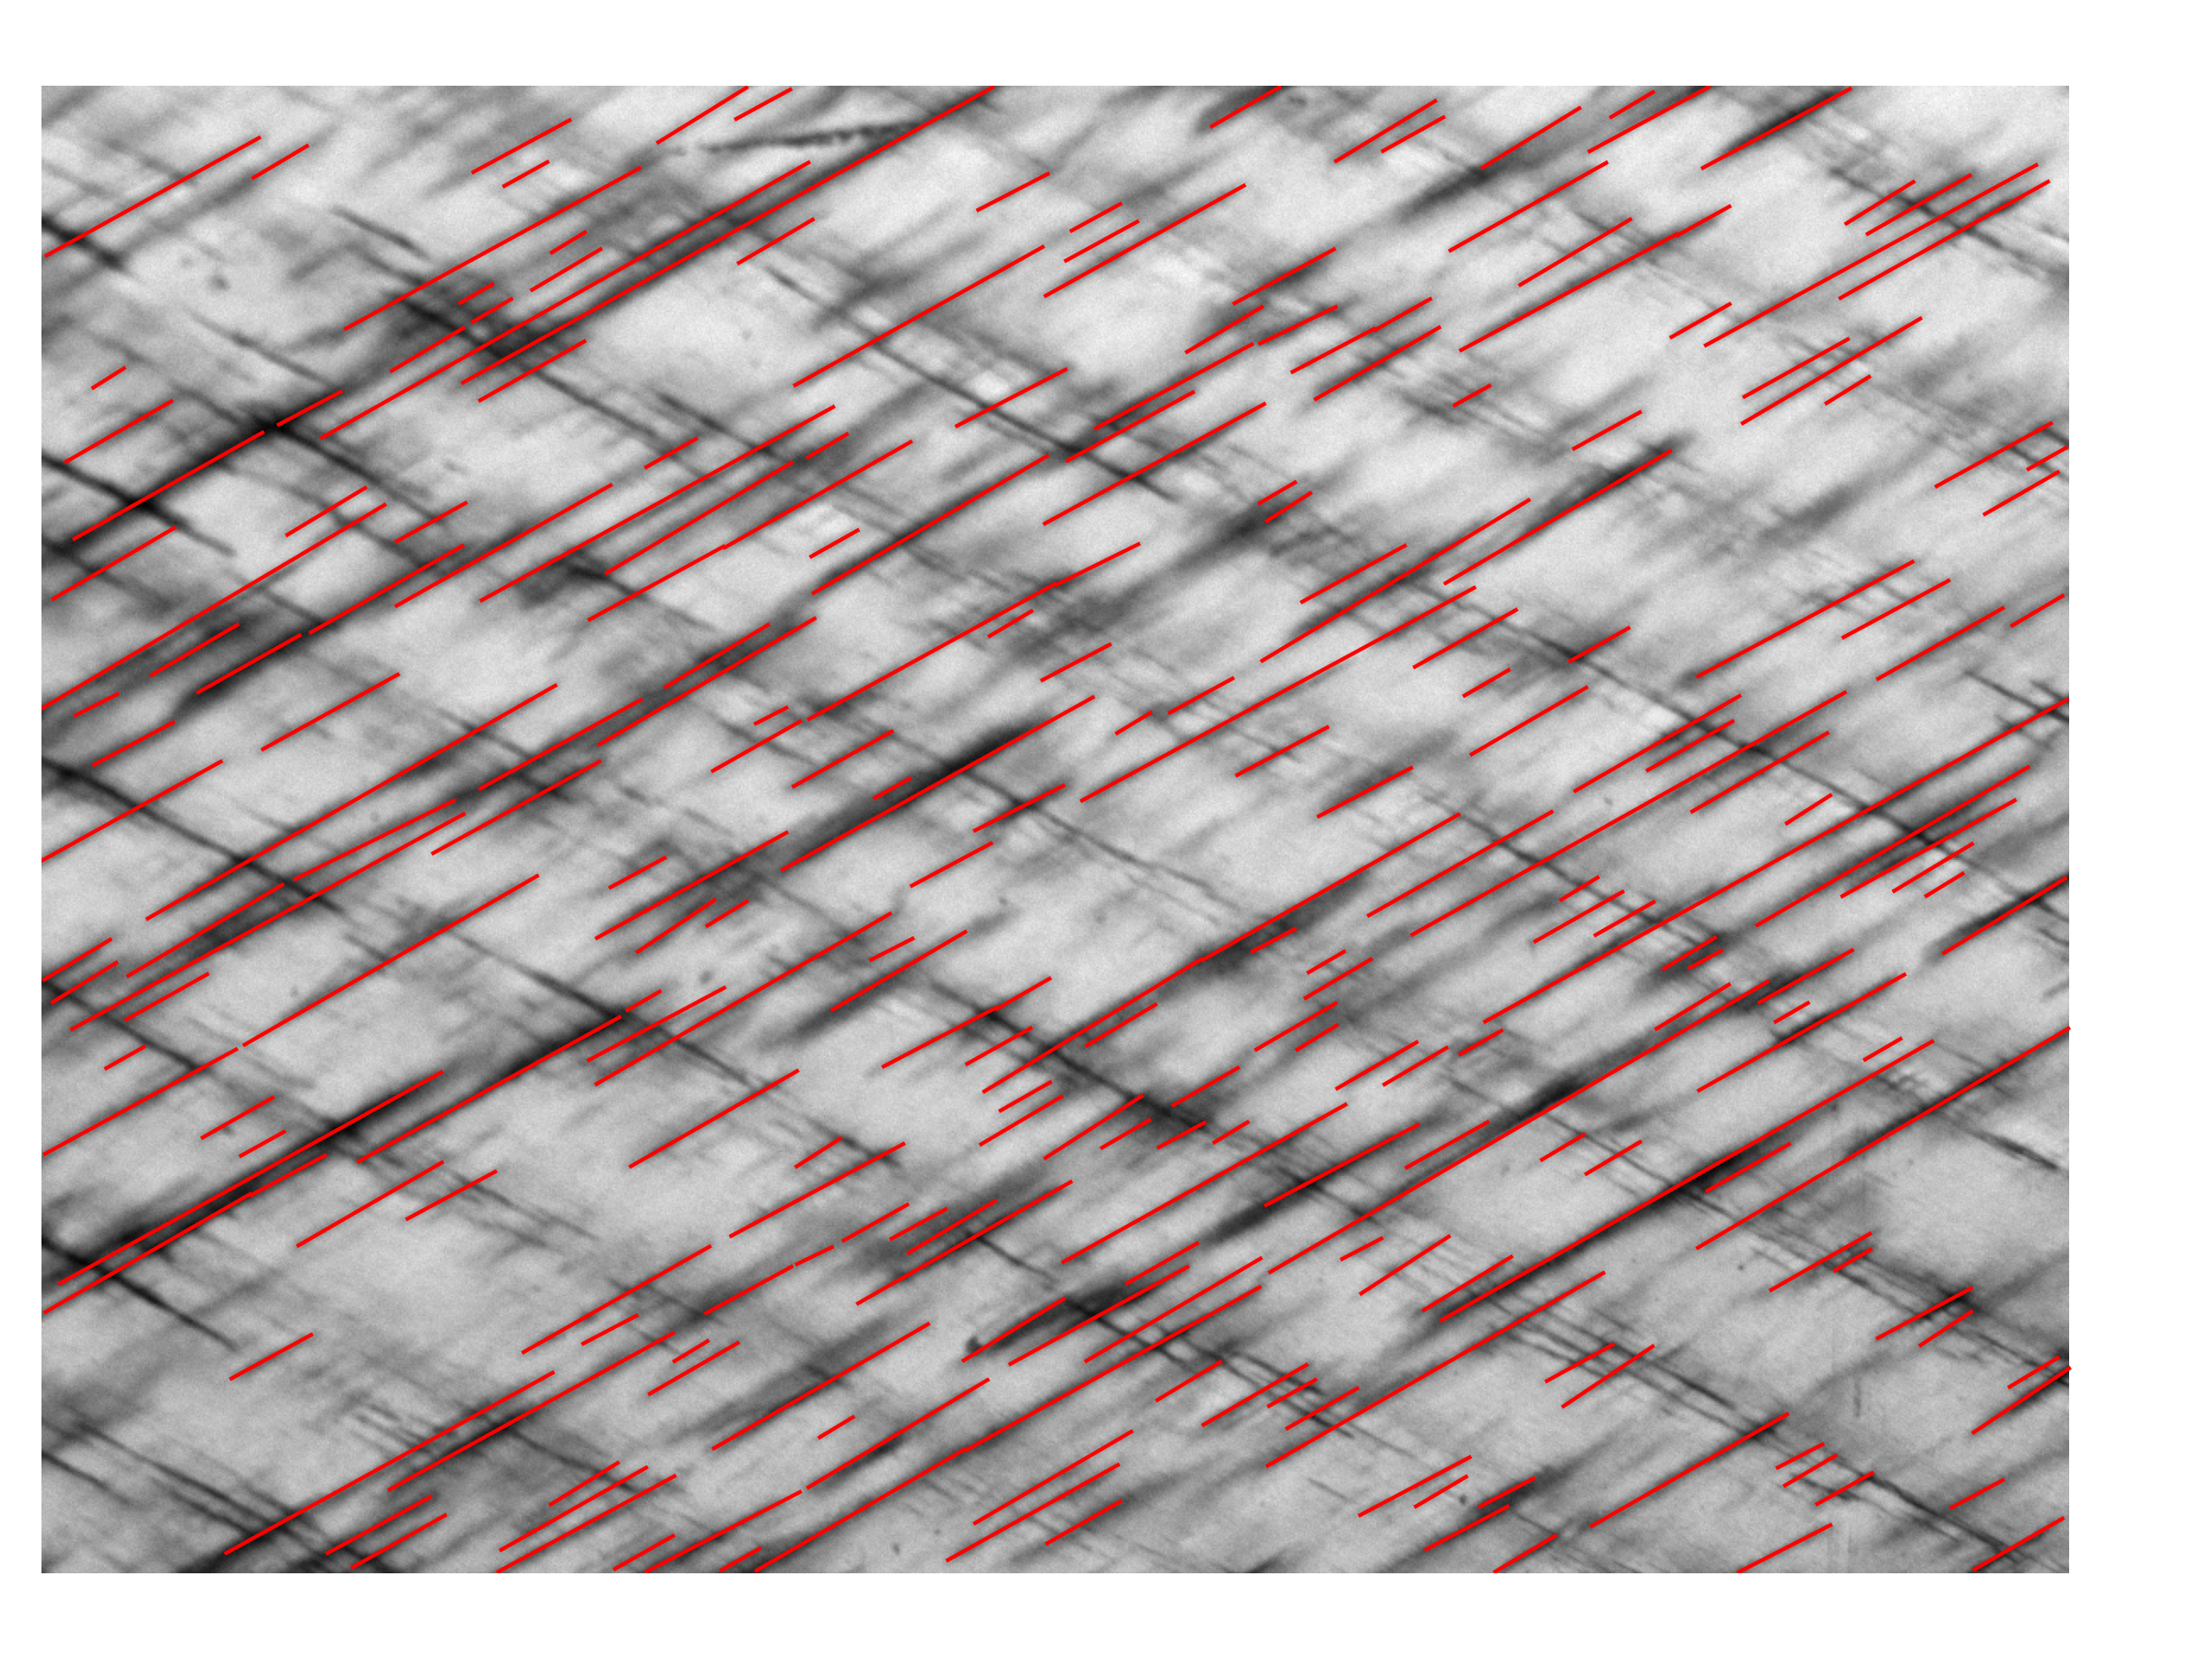
Nearly all cracks get detected. Some cracks are too close to each other and the crack detection can not distinguish them. Cracks in other directions are not detected. This image has low contrast so it is hard to detect all the cracks since some are quite faint compared to the background. There is also quite a lot of blur at some cracks. This are the main problems with the crack detection. This image would benefit form an histogram equalization to boost the contrast.
The full script:
import numpy as np
import crackdect as cd
# read image paths from folder
paths = cd.image_paths('example_images')

# We want the dtype of the images to be np.float32 and only grayscale images.
stack = cd.ImageStack.from_paths(paths,  dtype=np.float32, as_gray=True)
# shift correction to align all images in one coordinate system
cd.shift_correction(stack)
# The region of interest is form pixel 200-1400 in x and 20-900 in y
cd.region_of_interest(stack, 200, 1400, 20, 900)
# crack detection
rho, cracks, thd = cd.detect_cracks(stack, theta=60, crack_width=10, ar=2, bandwidth=1, min_size=10)
# plot the background image and the associated cracks
cd.plot_cracks(stack[-1], cracks[-1])